A Tale of Two Counties: Vax mandate versus no mandate
In the Bay Area, we have an interesting opportunity to look at the efficacy of vaccine mandates in neighboring counties.
 |
| Like in San Francisco, restaurants in Contra Costa now have security with guns trained on people as they enter, in case they dared enter to eat an al pastor taco without proper documentation. In San Francisco, though, they will let robbers through, no problem. // photo by Nur Andi Ravsanjani Gusma |
Alameda County and Contra Costa County are two adjacent counties in the Bay Area. There are many shared similarities between the two adjacent counties. Alameda tends to be a bit more urban, with Oakland and Berkeley within its borders, but Contra Costa contains Richmond with Walnut Creek being a burgeoning city, though much more posh and smaller than the other cities mentioned. Contra Costa is slightly more conservative overall, with Danville as the right-leaning city locals think of, but Alameda stretches all the way east and has Livermore as its eastern anchor, where one could see American Flag-toting pickup trucks and probably the most likely city between the two counties where one could spot a Trump sticker or even a MAGA hat if you sit at a Walmart parking lot long enough. Alameda, conversely, seems to be slightly more progressive, with Berkeley as its hotspot, but Richmond for Contra Costa is an extremely blue city, but more famous for its violent crime than showering-is-optional vegans. Granted, the county party differences aren't exactly large. In both counties (AC and CCC), every single state and US representative elected are all Democrats, as of the 2020 election. By voter registration, Alameda has 60.2% Democrats and 10.9% Republicans, while Contra Costa has 53.7% Democrats and 18.5% Republicans. When walking around either county, there tend to be similar rates of mask-wearing for comparable cities, suggesting the norms are not terribly different from each other. When going to the peninsula, to say, San Mateo County, the difference is readily apparent as people wear masks much more stringently, even outdoors.
Despite this, it is Contra Costa County that enacted a vaccine mandate for activities such as dining indoors. Alameda County has thus far, stayed away from vaccine mandates, with the exception of Berkeley, as a city ordinance, passed on September 1st, 2021, and took effect on the 3rd. Oakland has also passed a vaccine mandate, but it does not go into effect until February, so it does not affect this comparison. To my knowledge, no other city in Alameda County has passed a vaccine mandate. Both counties have had mask mandates, with a short break last summer, even when the state did not mandate them.
If vaccine mandates are as important and surefire a deterrence as we are told to believe, certainly enough to remove basic rights and freedoms for those that don't get vaccinated, we should see a rather large divergence in COVID figures between the two counties. Contra Costa began enforcement of its vaccine mandate on September 22nd, so we now have several months of hard data.
Let's take a look. Keep in mind the population differences when viewing these first charts, since they're in absolute numbers, not per capita. Alameda County's population, per April 2020 census, was 1,682,353. Contra Costa County's population was 1,165,927. By these numbers, Alameda's population is 44.3% higher than Contra Costa's.
All data below are from the LA Times pulled on January 23: Alameda tracker and Contra Costa tracker. I roughed in the vax mandate marker for Contra Costa. See Archive.org for historical snapshots of the pages for Alameda and Contra Costa (unfortunately, the charts and maps don't all show up in the archives).


No, that's not Michael Mann's hockey stick graph, made famous by Al Gore pasted in there. That giant spike under new cases by day is Omicron. People should find it interesting that while the cases graph turned into a giant cliff, the deaths chart basically stayed flat. Apparently, people have not looked at these charts, given the insanity over the past two months.
At any rate, the charts of the two counties are rather striking. The Alameda chart compared to the Contra Costa chart is...what? Oh, you don't know which chart is which? Huh. One has a vaccine mandate. The results should be clear! It's not?
The top chart is Alameda. The bottom chart is Contra Costa. Those more astute may have picked up on the y-axis numbers and figured out that the chart with higher aggregate numbers is Alameda since they have a larger population. If they were erased, there is no way to tell the two apart.
The key thing is...the graph trends between the two counties are virtually identical. If vaccine mandates were so critical that we must violate the rights of hundreds of thousands of people to eat inside a restaurant, you would expect a large divergence in results. But there hasn't been.
So, has it at least encouraged people to get vaccinated? As we see in the following graph, it has not.


The two counties have virtually identical vaccination rates, both before the vaccine mandate and after. On August 31st, just picking a random date before Contra Costa's mandate, Alameda had 74.5% and Contra Costa had 74.3%. Today, vaccination rates are similarly close, well within normal fluctuations. So the mandate utterly failed here as well, before even going into the ethics of forcing someone to do something for their own good.
We cannot say that the same vaccination rates make the cases and deaths comparison invalid, however, as if the vaccinations are the sole indicator of viral transmission. One of the key "features" of the vaccination mandate is to forbid unvaccinated people from gathering in common indoor spaces where people more easily spread the infection. We see that this does not hold in the slightest. Whether the unvaccinated congregate in these spaces, does not appear to matter, as if the vaccines don't prevent infection spread well, if at all.
So the vaccine mandate didn't get people to vaccinate more and it didn't prevent cases or deaths.
What, exactly, did this all accomplish?
Oh, yeah:
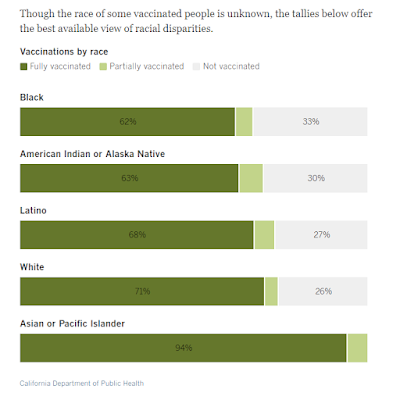 |
| Vaccines by race for Contra Costa. There was one Asian who did not get at least one jab, but we found my cousin Johnny and his mother dragged him by his ear to the nearest injection site. |
Contra Costa stripped the rights away from minority populations for nothing. 38% of black people, 37% of American Indians, and 32% of Latinos have been barred from simple rights like eating in restaurants and going to the gym. Whatever happened to "disproportionately affects the black population"? I suppose that only matters when convenient.
The pages also have heat maps of regions within the county, which is interesting, but I've found that they fluctuate quite a bit. One day, Berkeley is a hotspot of COVID activity compared to all other Alameda areas and a few days later, it's the reverse. It would have been more useful if the data was given a wider average.
Perhaps also worth mentioning is San Francisco County (basically the city), which had a vaccine mandate start on August 20th, a month earlier than Contra Costa's. Its population is smaller, at 873,965 than the other two counties, given the relatively small landmass it commands. The culture of this county would vary much more than either Alameda or Contra Costa for rather obvious reasons, but it is adjacent to Alameda as well. Did it make a difference? Doesn't seem like it. The daily cases and deaths follow pretty much the same trend lines. While the vaccination rate total is higher, the trend line is the same with no spike after the mandate went into effect. White people having some of the lowest vaccination rates among races is somewhat surprising, but still, 30% of the black population can't eat in a restaurant inside their own city.
Granted, there are some problems trying to conclude with a high degree of certainty from these comparisons of the two, or even three, counties alone. For one, just comparing two counties is a pretty low sample size. But I'm willing to bet that this similarity is the rule, not the exception. Also, people, particularly in the edges of the county, can cross over into the adjacent county and have a meal there, though it's not clear what that difference would be. It's also not a given that people would only try to escape Contra Costa for a meal; vaccinated people in Alameda may decide to go to Contra Costa because they feel safer with a mandate. But given the severity of the rights stripped, we should be seeing some difference (a drive from Walnut Creek to Oakland or Dublin to cross county lines for a meal is not insignificant).
Still, the results for these residents at least, are clear. The vaccine mandates made a lot of people's lives much worse off for no measurable public health payoff whatsoever.

